1. Purpose:
The quiz aims to assess intelligence.
2. Procedure:
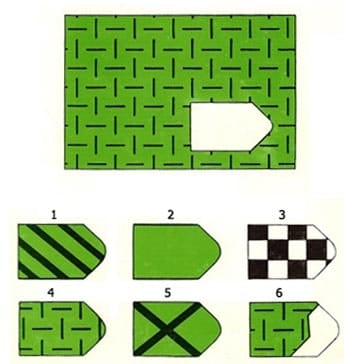
– Instruct the patient: “Please observe this picture. Here (pointing to large picture A1) there is a missing part. Please find a suitable image from the ones below to fill in the missing part and tell me which number it is.”
– If the patient does not understand, emphasize the matching factor. Avoid letting the patient focus on the size of the image.
– You can reinforce with picture A2.
– Once the patient understands the procedure, do not provide any further explanations.
– If there is a tendency to rush leading to incorrect answers, you can adjust the pace with questions like: “You just said which picture number?”
The image illustrates a small part of the review
3. Result Handling:
– Compare the patient’s results with the answer key. Each correctly solved exercise counts as 1 point.
– Calculate the total score for each set of exercises and for the entire quiz.
– Compare with the expected score table. The results are considered reliable if the difference for each set of exercises does not exceed 2 and the total differences do not exceed 6. However, in clinical settings, if there is a significant deviation from the standard distribution, further investigations may be necessary to determine the cause.
– From the total score, refer to the table to determine the IQ score (table for ages 16-45).
+ Regarding IQ scores (according to Wechsler, 1981):
Above 130: Very intelligent.
From 120-129: Intelligent.
From 110-119: Above average intelligence.
From 90-109: Average intelligence.
From 80-89: Below average intelligence.
From 70-79: Borderline intellectual functioning.
Below 70: Intellectual disability.
+ Classification of developmental delay (according to ICD-10, 1992):
From 50-69: Mild developmental delay.
From 35-49: Moderate developmental delay.
From 20-34: Severe developmental delay.
Below 20: Profound developmental delay.
– Intelligence level can also be assessed using percentile scales (according to standard age groups) as follows:
| Level | Evaluation of results | Comments |
| I | Excellent | The result is equal to or greater than 95%. |
| II | Good | The result is equal to or greater than 75%. |
| III | Average | The result is between above 25% and below 75%. |
| + | Above average | The result is above the average for the age group. |
| – | Below average | The result is below the average for the age group. |
| IV | Weak | The result is equal to or less than 25%. |
| V | Very weak | The result is equal to or less than 5%. |